One of my favorite tactics when performing an SEO audit (routine or a fresh start) is extracting existing data from Google’s tools. It’s free, it’s somewhat accurate and it’s easy to analyze.
This usually gets me both some quick wins and a general sense of direction for my in depth keyword research.
Note that this tactic is only relevant for sites that have a substantial Organic impact so that their numbers are something you can work with. Usually around 5K Organic monthly sessions should be sufficient for this.
I’ve started practicing this once Google upgraded the good ol’ Webmaster Tools to the Search Console. One of their key changes was a revamp to the Search Queries report, which also changed its name to the Search Analytics report.
One of the main criticism of the old report was the partial and inaccurate data it provided. While the new report still provides only a limited set of data, I have been able to better correlate it with actual traffic and Keyword Planner data.
Note that the data from the Search Analytics report is limited to no more than last 90 days
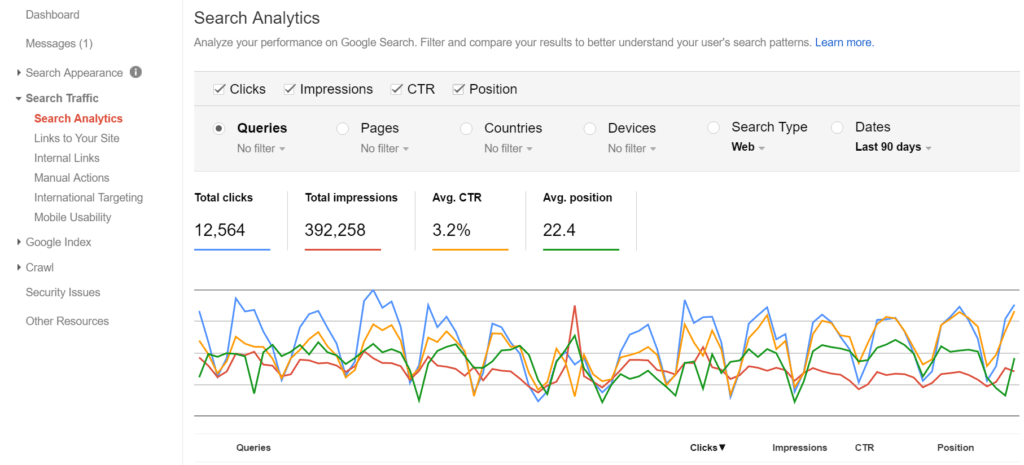
Search Analytics Report
This report is accessible in your site’s Search Console under ‘Search Traffic -> Search Analytics’.
In this report you can see a breakdown of actual search activity broken by several metrics and dimension.
The main dimensions are Queries and Pages, but you can also filter the data by Country, Device (Desktop, Table & Mobile), Search Type (Web, Image, Video) and Date . Metrics span Clicks, Impressions, CTR and Average Position.

In the report we can use the dimensions in conjunction. For example, clicking a specific query and then switching to the Pages tab will show all the pages that ranked for it. Similarly, clicking on specific page in the Pages tab and then switching back to the Queries tab will show all the keywords that page ranked for.
Ideas for querying
- Sort your pages by Impressions. Drill into the top ones to see which keywords they rank for. Identify keywords that are on 2nd/3rd page (rank 11–30) and check how you can better optimize your content to match these queries.
- Filter pages that contain PDF or Doc to find files that aren’t HTML but are receiving traffic that isn’t otherwise appearing on GA reports (See my other post for details)
Note that the rankings provided by Google aren’t entirely accurate. They can give the general trend but are in no way a reliable tool for tracking rankings.
Google Analytics
So we’ve covered over the Search Analytics report, but how does Google Analytics fit in all this you ask?
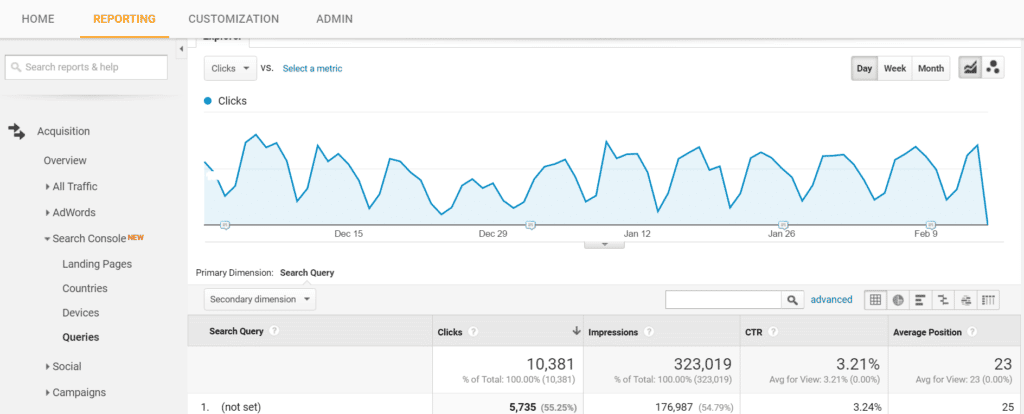
Google Analytics (GA) has an option to connect your Search Console data to it. This is a nice function that brings up the same data as a built in report in GA. These reports sit under “Acquisition — Search Console”.

But these report are actually kinda crappy. They can only report on a single Dimension from the Search Analytics data while joining unimportant secondary dimensions (can only be useful in a global setting but otherwise rather pointless).
Where do they come in handy? They allow you to export far more query data compared to the Search Console report (999 rows limit).
If your site has plenty of content and has been running for a while, you can expect it to easily exceed that number. Using this export you can easily pull out the top 5,000 queries your site ranks for.
You can even pull 10K using the Google Analytics Spreadsheet Add-on.
Now this is something you can play with ☺
Ideas for querying
- Plug the whole list into a keyword density tool (like this one). See which terms are frequently ranked for (2 or 3 word strings). Then go back to Excel and mark the top phrases found. You’ll be surprised by what you will see.
- Filter the list to find question oriented queries, most commonly “how to” and “what is”.
You can now return to the Search Console report to understand which pages Google sees relevant for the strings found.
Compile a list of closely related strings and optimize the pages you identified. In many cases I have found that the page ranking isn’t sufficient so a new and targeted one should be created.
Real life use case
Working with a large TV network, I was given the task to help their site’s editors capitalize on Organic traffic for their leading reality show.
Using the above reports we could identify trends among contestants. This gave us insight as too who were the most popular couples in the show, based on their actual search volume.
Additionally, we analyzed the context in which they were searched on, both on a broad and page level.
Analyzing the data gave us several interesting insights. For example, contestants had to be introduced with their full names, rather than just first names. Other information about the contestants was also frequently searched for, like their height, so that was also added to their profile page. And as you probably can expect in reality TV, the most popular search was of a certain contestant in her bikini (which they ultimately also optimized for).
Final thoughts
This tactic can be applied for both a new and an ongoing keyword research. Though its scope is limited only to the context of the content already appearing on your site, you can still derive from it new content ideas.
One benefit is seeing what context Google puts you in, without you creating matching content, just because it finds you relevant enough.
Additionally, this can be used to navigate your content strategy around ideas within the context of your site. You can extract long-tail ideas for new content you should create.
Its downside is that this data isn’t coming in real time as Google maintains a 3 day delay on the reported data. And yet, a topic trending can definitely be identified by this.
Originally published on my blog on Medium.