Google Analytics 4 (GA4) has seen a revised Measurement Protocol (MP), that is still somewhat lagging behind on features that seemed trivial in UA.
One place it does (somewhat) shine is the debugging options it features. In this post I’ll try to walk you through them.
The issue with debugging GA4 MP
Hits sent to the MP are sent into a queue for processing. This means that all events will receive a 204 response without any additional context. This is due to the way these hits are processed. Since GA4’s MP is built to ingest billions of hits, it cannot delay its response and validate the incoming payload.
This is quite an issue with production data, as no immediate response code can indicate an issue with your data. And since no intraday reporting is available, and real time reports are dull, such an integration can easily break and fly under the radar until the following day.
Debugging GA4 MP
The above issues are painful but are mostly Production related. So how can we debug our Development environments?
GA4 MP provides two methods for debugging:
- Debugging endpoint
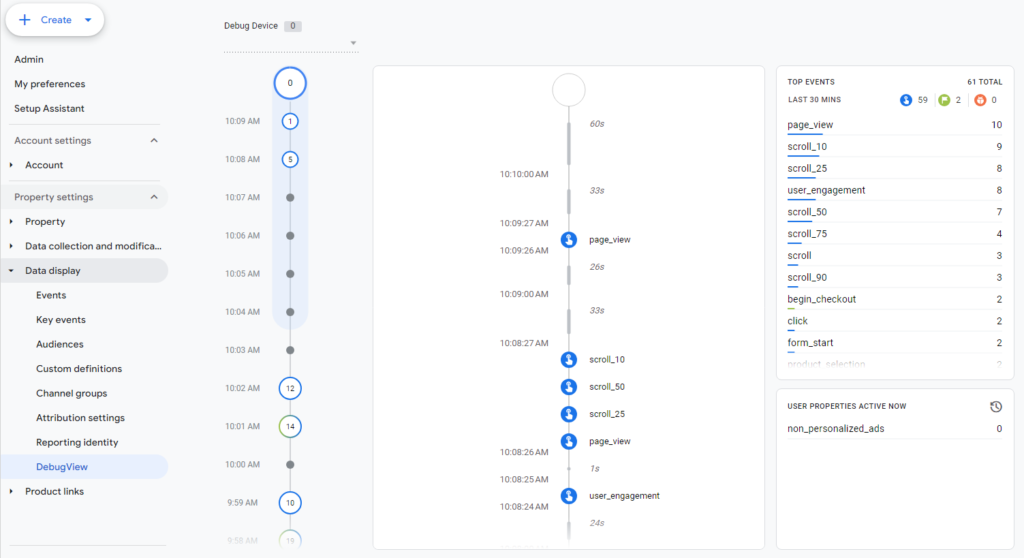
- DebugView in GA4
Using the debugging endpoint
The first step to working with GA4 MP is to use the debugging endpoint when building out your API.
A standard GA4 MP request will use this endpoint:
https://www.google-analytics.com/mp/collect?api_secret=abcdefghijklmnop&measurement_id=G-123456789
This endpoint will return only a 204 response.

If you want your hits validated, you need to add the /debug path to the endpoint
https://www.google-analytics.com/debug/mp/collect?api_secret=abcdefghijklmnop&measurement_id=G-123456789

Important note:
Hits sent to the /debug path are validated but will not show in reports.
Using DebugView
After validating that our hits have been ingested properly, now we can check if they are showing up in GA4 properly, and (hopefully) linked properly to the right sessions.
For example, in order for you to debug a real time transaction, you will need to use GTM’s preview mode (or directly use Tag Assistant) on your website. Doing this, will stream all you real time events into GA4’s DebugView.
The DebugView is accessible from GA’s Admin section under Data display.

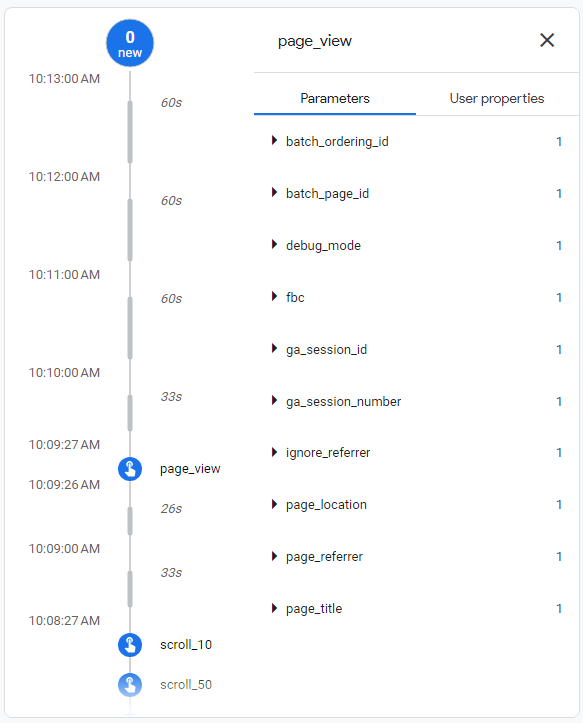
To connect MP events to the debug view, the events simply need to carry the debug_mode: 1 parameter.
This parameter is to be added on the event params level, for example:
{
    "events": [
        {
            "name": "purchase",
            "params": {
                "items": [
                    {
                        "price": 73,
                        "coupon": "banana",
                        "item_id": "142959",
                        "currency": "EUR",
                        "quantity": 1,
                        "item_name": "my cool product",
                    }
                ],
                "value": 73,
                "coupon": null,
                "currency": "EUR",
                "debug_mode": 1,
                "session_id": "1704269295",
                "page_location": "https://trackingchef.com/offline-events",
                "transaction_id": "140070"
            }
        }
    ],
    "user_id": "184",
    "client_id": "1054051101.1678866116"
}
Once added, these events will show in the DebugView report. Unlike the debug endpoint, these events will be processed and show in regular reports.
In the DebugView you can now check that the event’s payload came in properly formatted, that ecommerce items received all their parameters and so on.

Important note:
Do not leave the debug_mode:1 parameter on all incoming MP hits. Though this won’t damage data (as hits are still processed) it will substantially increase the number of debug devices active, making actual debugging of events difficult to handle.
Connecting the DebugView to an online session
In order for the MP hit to connect with a live session, for both debugging and attribution purposes, the user’s Session ID must be sent as part of the payload (as an event param). The full details on fetching and sending this value can be found on this post.