One of the challenges when working with Google Tag Manager (GTM) is the gap between preview mode and actual deployment.
Plenty of times, you deploy a tag with a certain configuration, and results show up entirely different. Sometimes this is due to the nature of edge cases that you didn’t think about or couldn’t simulate on your machine.
One tactic I’ve found for tracing back the source of the issue is simply logging the tag fired and its variables. This is done by capturing all these in an HTTP POST webhook that logs these in a Google Sheets spreadsheet.

To capture the webhook and pass the data to Google Sheets I’ve used Integromat, which is my go-to tool for automations, but you can also use Zapier just the same. You can create a free Integromat account here, and their pricing is very reasonable compared to Zapier.
Creating the Integromat Scenario
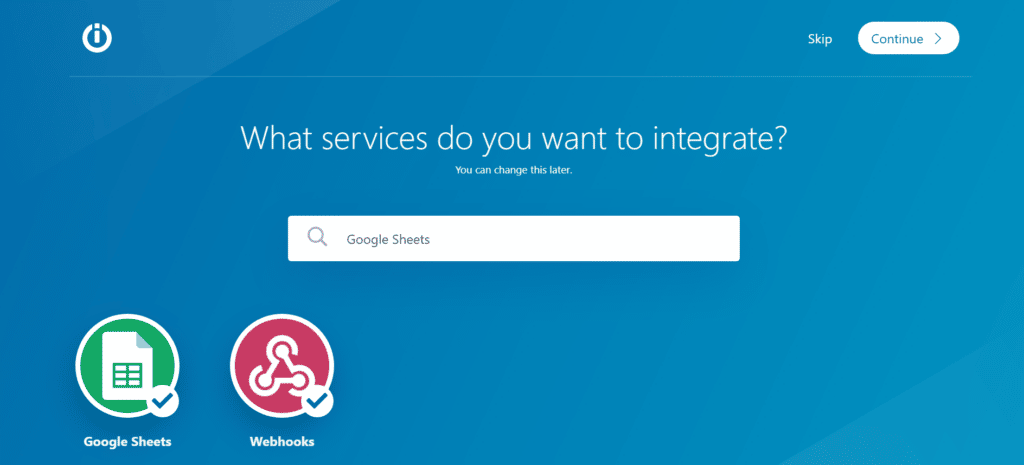
Log into your Integromat account and create a new scenario. For the scenario, select Webhooks and Google Sheets (can also do this later).
Select the Webhooks module as the first step and click “Custom Webhook”.
Click Add to create a new webhook URL and give it a descriptive name, e.g. GTM Logger.
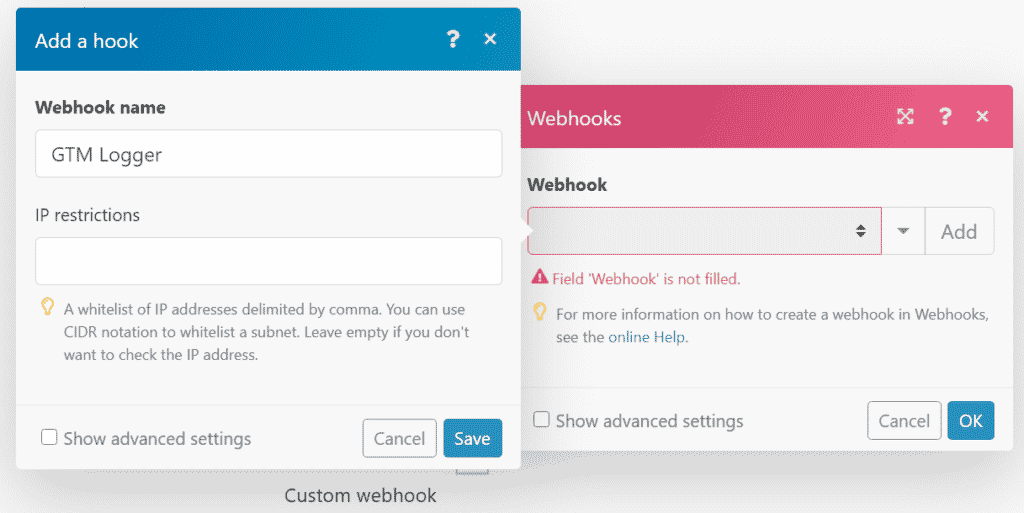
Copy the webhook’s URL and have it available.
Creating the Logger tag
In GTM, open the tag you want to log. Identify the specific variables it uses and the trigger that applies to it.
Then, create a new tag of the Custom HTML. In the tag’s body, paste the following snippet.
<script>
var xhr = new XMLHttpRequest();

// Paste below the webhook URL from Integromat
var url = "https://hook.integromat.com/abcdefg1234567";

var dl = dataLayer;
dl = dl[dl.length -1];
dl = JSON.stringify(dl);
xhr.open("POST", url, true);
xhr.setRequestHeader("Content-Type", "application/json");

//This is the payload data sent to the webhook
var data = JSON.stringify({
    "id": {{Google Ads ID}},
    "label": {{Google Ads Label}},
    "value": {{Product price USD}},
    "orderid": {{Transaction ID}},
    "currency": "USD",
    "dl":dl
});

xhr.send(data);
</script>
Webhook URL
Paste the webhook URL from Integromat in the appropriate place.
Data Layer
As an extra way to analyze, I’ve also added the current Data Layer to be sent with the webhook. No changes are required here.
Payload Data
The payload data sent to the webhook is structured as a JSON. This means that each variable has a pair of key and name separated by a colon, e.g. “orderId” : “12345”.
In this example the date sent comes from a Google Ads tag, so I wanted to capture the values sent in its different variables:
{
“id”: {{Google Ads ID}},
“label”: {{Google Ads Label}},
“value”: {{Product price USD}},
“orderid”: {{Transaction ID}},
“currency”: “USD”,
“dl”:dl
}
The values using Curly brackets {{ are variables from GTM, same as the ones used in the Google Ads tag I was debugging.
The Currency was set as a constant, so I didn’t use a variable but rather set it as a string.
The DL is simply the Data Layer captured at that moment.
You can edit any of these, add and remove, to tailor this to the payload you want to capture.
For example, when debugging a a Google Analytics event you can send:
{
“eventCategory”: {{eventCategory}},
“eventAction”: {{eventAction}},
“eventLabel”: {{eventLabel}},
“eventValue”: {{eventValue}},
“nonInteraction”: {{nonInteraction}},
“dl”:dl
}
Trigger
After adjusting the tag’s structure, you can add a trigger to the tag. Most likely this will be the same trigger as the tag you’re debugging.
Sending the request data
After you’ve set up the Custom HTML you can publish it and wait for a request to be sent (you can trigger on yourself of course).
Pro tip:
You can also manually send the data to Integromat using a tool such as Request Bin. Just set the request type to POST and paste the JSON in the request’s body (with dummy values instead of variables)
Once the first request has been processed in Integromat, the data structure in the scenario will be determined and you can move onwards to the next step.
Mapping the values to Google Sheets
First, create a new Google Sheets spreadsheet that will serve as the log. Add headers in the first row to capture each value sent. I also like to add a timestamp column.

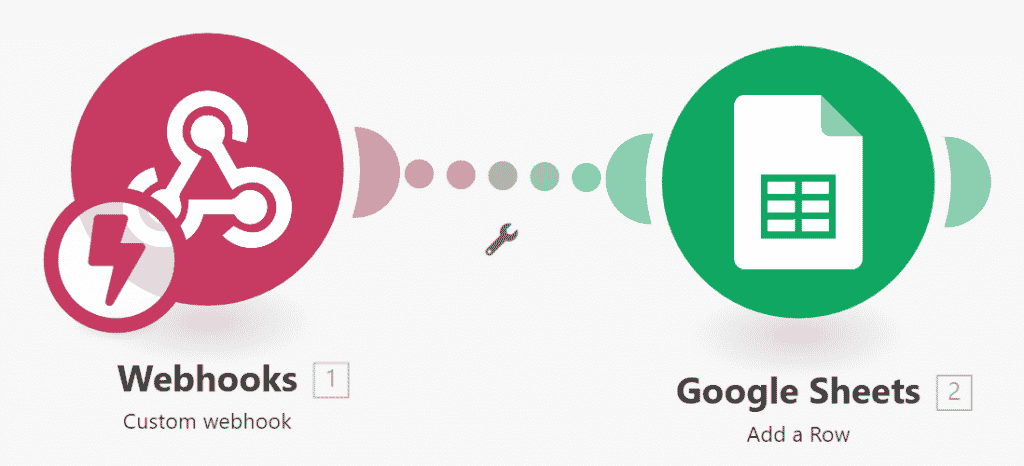
In the Integromat scenario, add a new module of the type “Google Sheets – Add a row”.
Select the connected Google account (or create a new connection). Then select the Spreadsheet and sheet you want to use. Once the spreadsheet loads, you will see the headers you’ve added and can now map the values to them.
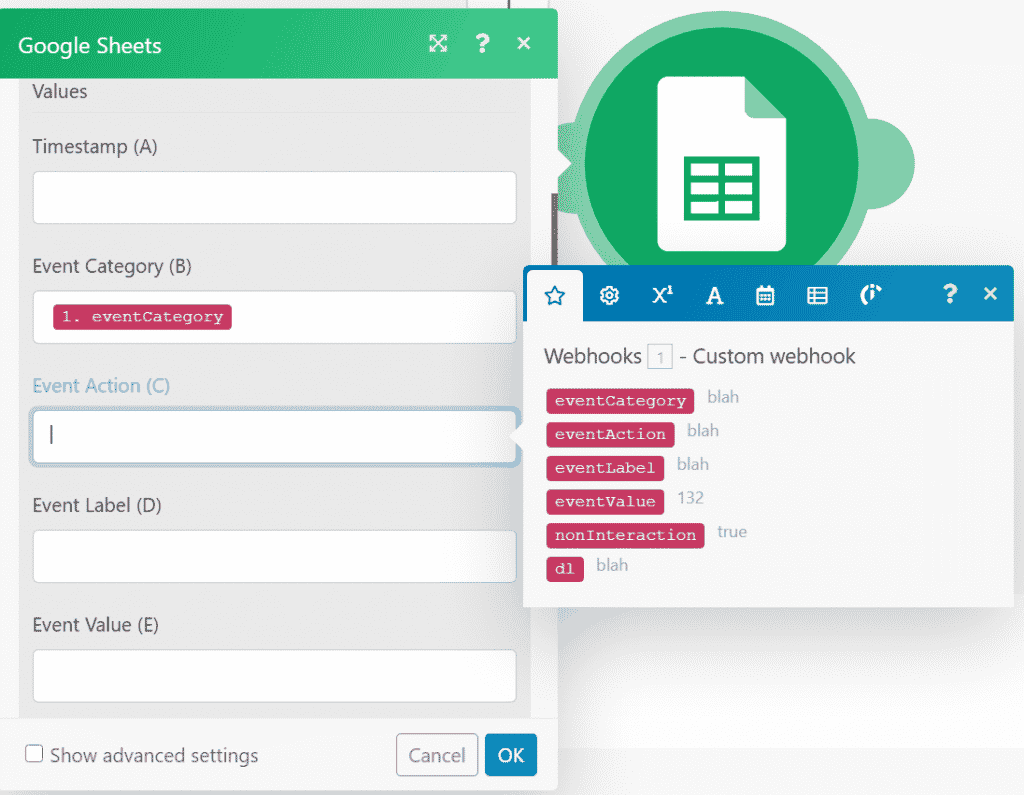
The Timestamp value can take the now variable in Integromat.
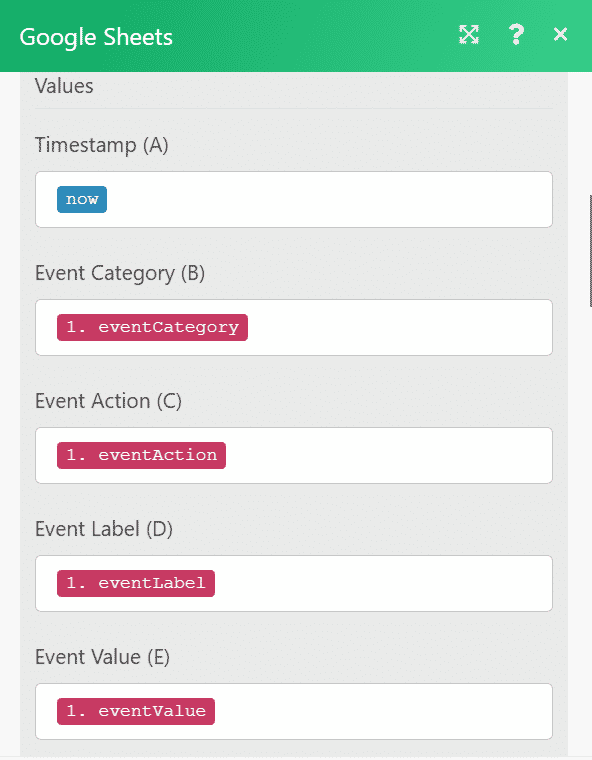
Save the mapping and activate the scenario. You’re all set.
Viewing the logger
As new webhook calls come in, they will be added as new rows in Google Sheets. The first row might carry over the formatting of the header (Bold and Underlined as in my case), so simply remove the formatting and new rows will continue unformatted.

Caveats
Well, not everything is perfect.
First, Integromat has a limit on its free tier for how many operations you can use. The free plan has 1,000 operations, so the two modules in the scenario use up, well, two operations per run which leaves us with 500 logs per month on the free tier. Their next tier of 10,000 operations is only 9$/month, so there’s no real reason not to use it for deeper logging.
UPDATE
The magnificent Eyal Gershon pointed out that you can create a similar solution with Pipedream that features a higher operations count on their free plan. Not sure you’ll need it, but it’s good to have.
Second, you’ll still need to find the bug. Sometimes it will show up in the variables sent (as in my example above). Other times it will show in the Data Layer sent.