In this post, we discuss advanced tactics for using Google Analytics to drive growth in Ecommerce campaigns. These tactics were extracted from an expert session given by Assaf Trafikant, CEO of Quickwin, at a professional meetup hosted by Fixel.
Assaf is a Web Analytics expert, who led the development of this professional field in Israel since its early days. He is also a CRO expert, working with brands in all shapes and sizes to drive incremental growth.
This session in the video below was held in Hebrew but is summarized fully in English below. The full deck presented is available on this link.
Tactic #1 – The “right” campaign sells the “wrong” product
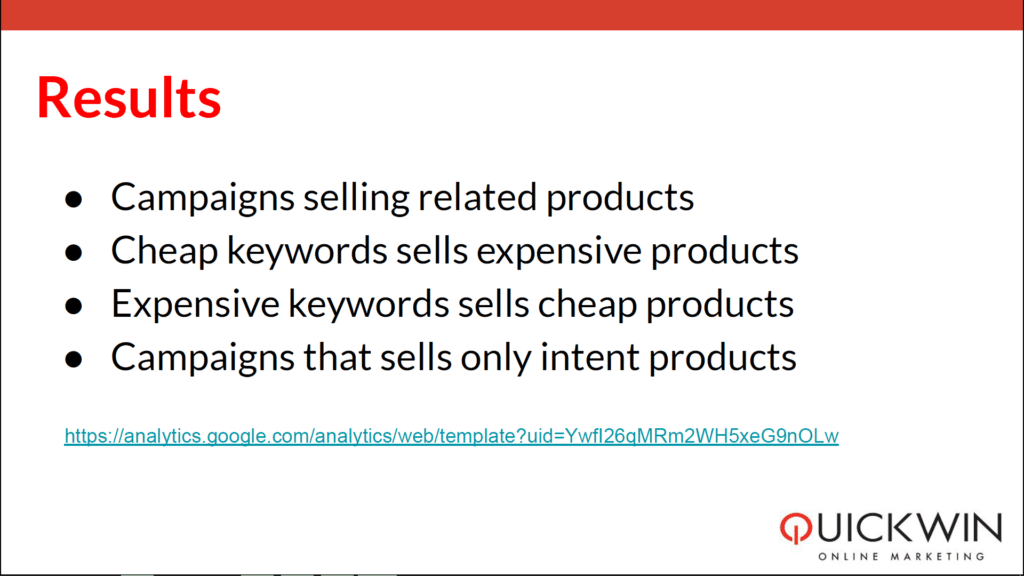
One of my favorite tactics is once we have enough campaign data, to check if certain campaigns, aimed at promoting Product X, are actually driving sales for Product Y. While we assume that any campaign aimed at Product X can end up selling Product Y, as people frequently buy several items in a single cart, we’re looking to identify patterns that go deeper.
For this analysis, we ignore campaigns that are based on brand and focus rather on ones promoting specific solutions. In a Pharma example, we’d look at campaigns for a hair conditioner that impacted the sales of hand soap.
We’re interested in these patterns, as when these are large enough, we can often find a cheaper way to sell expensive products. For one of my clients selling protein powder, which is a rather expensive keyword, we were able to promote “Protein Shakers” instead. These sold at a bargain of 2$ with free shipping but drove sales for a protein powder that was far more expensive and profitable for the client. And of course, we had all this audience in our pixels for future campaigns.
This insight came from analyzing the purchases of users that bought the protein powder and were frequently adding the protein shaker to their cart.
The logic described here is as appears in Google Analytics, but can be applied across any similar web analytics platform such as MixPanel and others.
For this analysis, I usually build a report off of Google Sheets data in SuperMetrics.
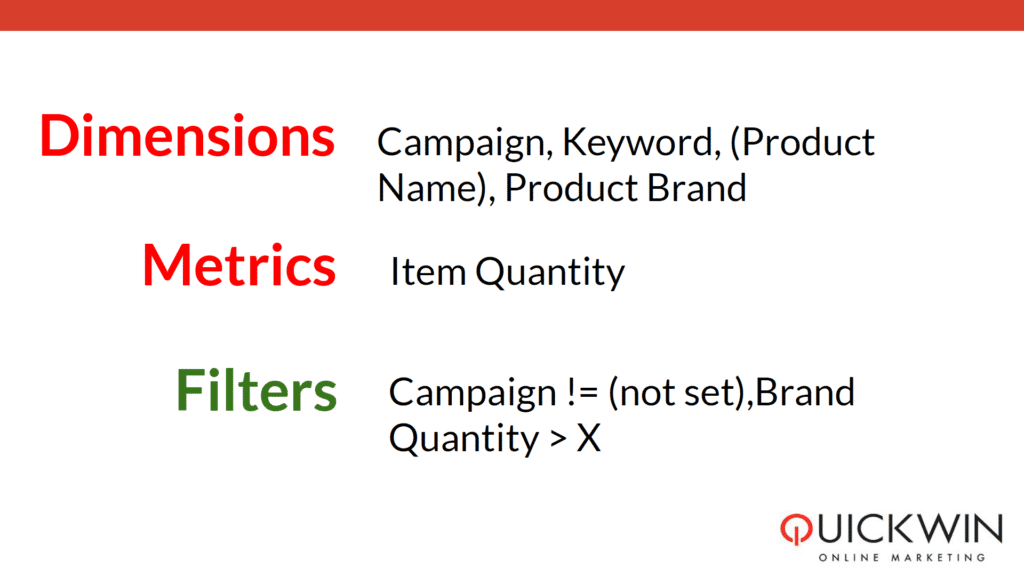
To the report I add the following dimensions:
Campaign, Keyword, Product Name, Product Brand.
I care about the Brand as it allows me to easily identify the gap between categories promoted in the Campaign/KW vs. the ones actually sold.
These are coupled by the Item Quantity metric.
The report is filtered to contain only campaigns that I can identify (otherwise I can’t identify the gap) and ones that have sold over a set amount of Product Y, which can vary across industries.
Quick link to import the report to you Google Analytics account.
(make sure you edit the Brand in the filter!)
Another outcome of this analysis is manually altering the related products shown. If we decided to actively promote Product X for selling Product Y, we should match the related/suggested products across the user’s journey to promote Product Y.
Tactic #2 – Identify User Retention With Custom Dimensions
Another quick tactic I like to use is rooted deeply in the world of Gaming, with the logic of FTD’s (First Time Deposit). Acquiring a new user is far more valuable than a return purchase from an existing user, and most times will be more expensive to achieve. This is why it is highly important to be able to easily distinguish between new and return purchases. Accordingly, campaign conversions can be set to achieve these distinct goals.
To achieve this, I send several user attributes that I pull out of the CRM, back into Google Analytics as Custom Dimensions (CD).
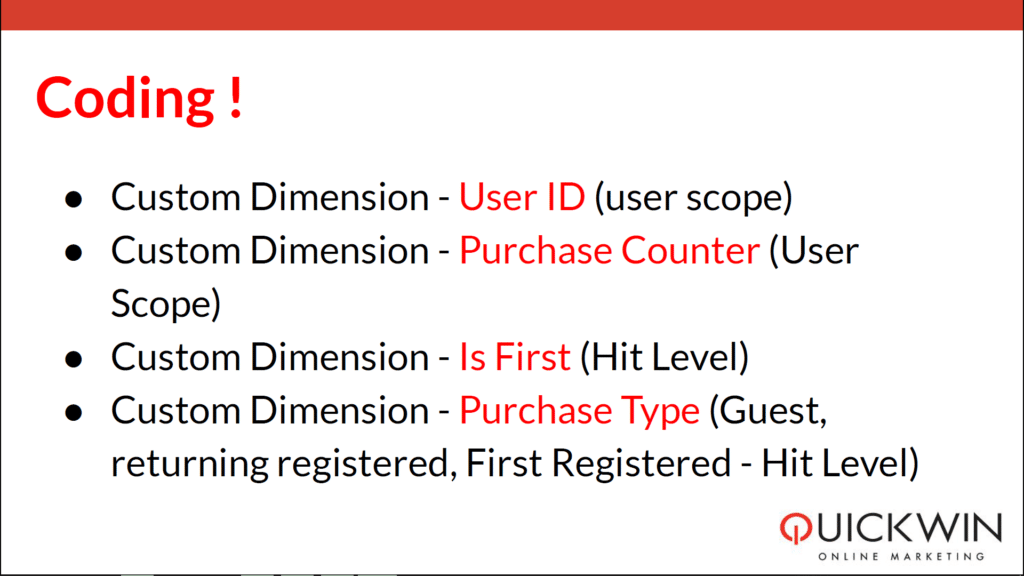
User ID
This CD uses a non personally identifiable ID of the user (e.g. CRM ID)
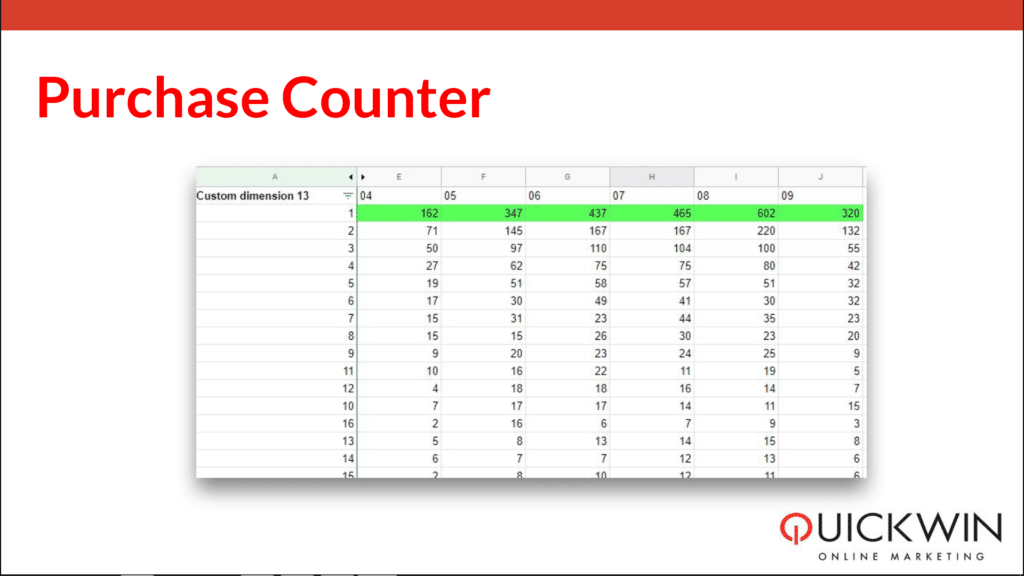
Purchase Counter
This CD shows the cumulative count of purchases done by that user.
Is First
Similar to the Purchase Counter, this CD carries a Boolean value (YES/NO or True/False).
Pro tip:
This value (Is First) can also be used to trigger an event in GTM that can act as a separate conversion event for Google Ads/Facebook Ads to optimize against, putting more focus on First Time Purchases.
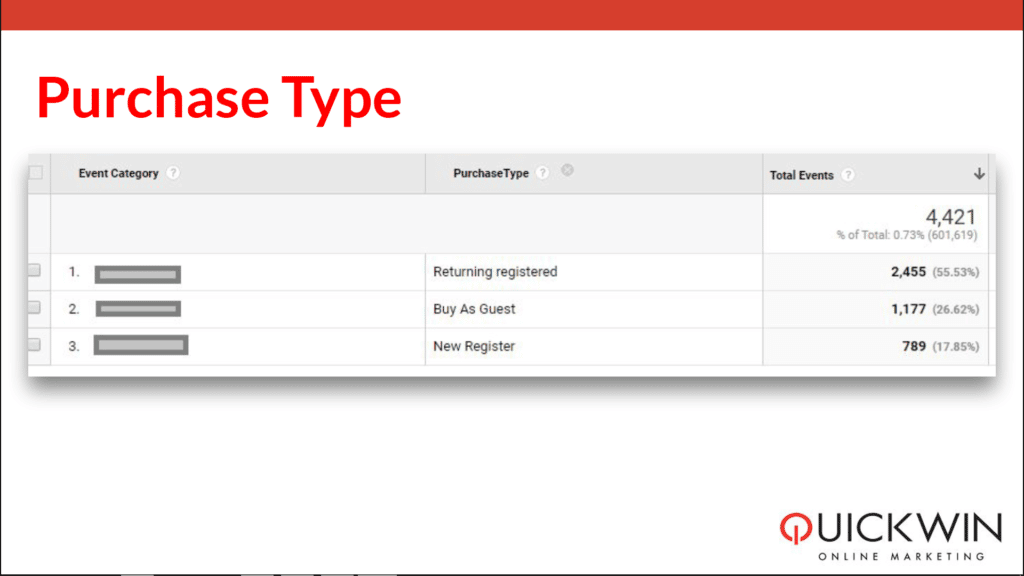
Purchase Type
This CD carries the Checkout method selected by the user – Guest checkout, Returning Registered, or First Registered.
Note that the first three CD’s are measured regardless of the method explicitly selected by the user (as Registered users can often checkout as Guests). Since we have a strict identifier, the user’s email, the data should always be accurate.
The fourth CD, Purchase Type, enables us to identify if users prefer a Guest checkout, which might result in a more fragmented data set for the client. In this case, we might consider adding incentives to convince users to log in.
In this report, Column A is the Purchase Count and the topmost row is the Month. We can easily observe that 30-35% of purchases are First Time Purchases.
In this report, we can easily see the distribution of checkout methods selected by users, with what is probably too high a ratio of Guest checkouts.
In one example I observed with a client of mine, we noticed that weekends drove a higher proportion of Registered checkouts. While we didn’t quite understand the reasons behind this, we decided to run campaigns aimed at first-time registered purchases on weekends and saw great results.
Tactic #3 – Stock Buyers
Stock buyers are users that, well, purchase in large bulks. The definition of bulk can vary greatly, as in Fashion you might want to identify a person buying 5 pairs of jeans, while in CPG Retail the threshold would rise to 20 shampoo bottles.
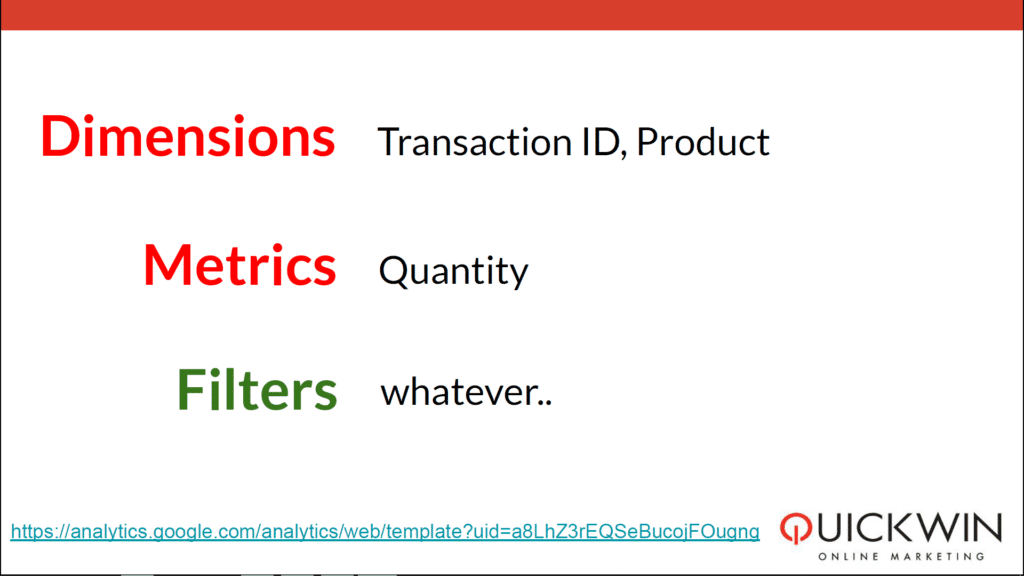
Quick link to import the report to you Google Analytics account.
This report is pretty straightforward, and contains the Dimensions of Transaction ID, Product and the Metric of Quantity. The filters for the report will be set based on the logic described above.
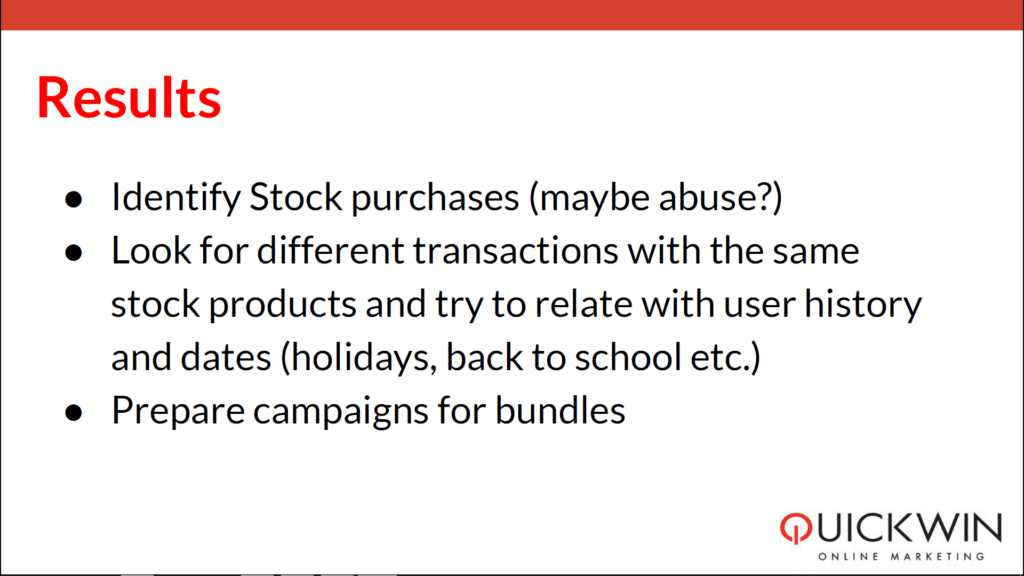
In one example, working with an online supermarket, we were able to segment a group of “Home Bakers”, by identifying users that purchased a large quantity of flour and eggs. We can now create an audience for these users specifically that can promote items that are more relevant to them.
In another example, a client of ours asked me to identify users that purchase a stock so that they can identify if they are then reselling it elsewhere and abusing their discounts.
This tactic can be used to identify trends, such as mini bottles of hand sanitizer (Alcogel) that are often purchased in bulk before the school year begins. We can use this insight to offer bulk discounts for these and use it to drive quality traffic.
Tactic #4 – Out of Stock
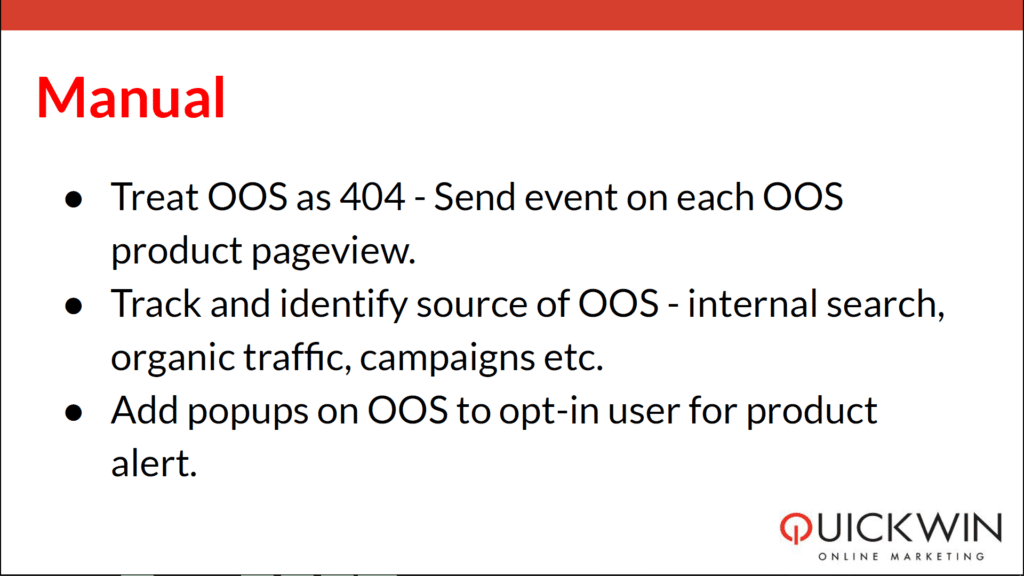
When working with a large ecommerce site, I like to treat Out of Stock (OOS) as a 404 page on the site in terms of severity and to be informed of this in Google Analytics. I usually will send an event via GTM to indicate this.
Even if the shop owner can’t change their stock, they can at least do some proactive response, such as triggering a pop-up that suggests they sign up to be notified when the item is back in stock, or suggesting other similar products.
