Originally published in Hebrew on the Lixfix blog
Google’s Looker Studio, previously called Data Studio, was one of the most useful tools for anyone using Google Analytics.
I write “was” because, on November 10, 2022, Google dropped a bomb when they applied multiple restrictions that make it difficult to build the reports.
In short, Looker Studio uses the Google Analytics 4 API to fetch data, and Google applied usage limitations to the API which limit the number of daily queries you can run.
For a lot of people, the reaction was “What’s the problem? We’ll fetch the data with BigQuery.”
In case you’ve been living under a rock, Google’s BigQuery is a database that has a free native connector to Google Analytics 4., All the data that reaches your analytics property is exported automatically to tables that allow you to access the data in its raw form (that is, before processing and without limitations).
What many don’t know, is that using BigQuery incorrectly with Looker Studio can cost you a lot of money.
Let’s look at an example.
A few days ago, a client asked me to build a report that shows how users came to a certain page, and to which page they continued.
In Universal Analytics, this report exists as a standard report, and this client wanted me to create a similar report for him in Google Analytics 4
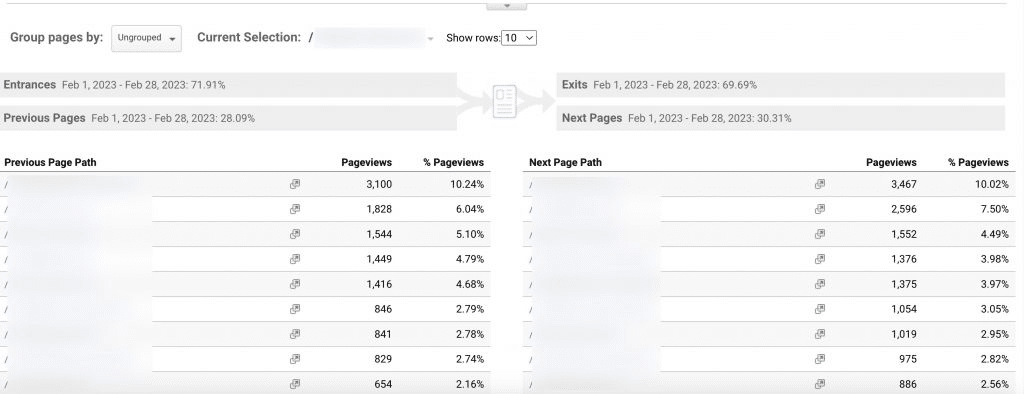
This is what the report looks like in Universal Analytics
Well, I immediately turned to BigQuery, and created the following query for it, which produced the exact same report:
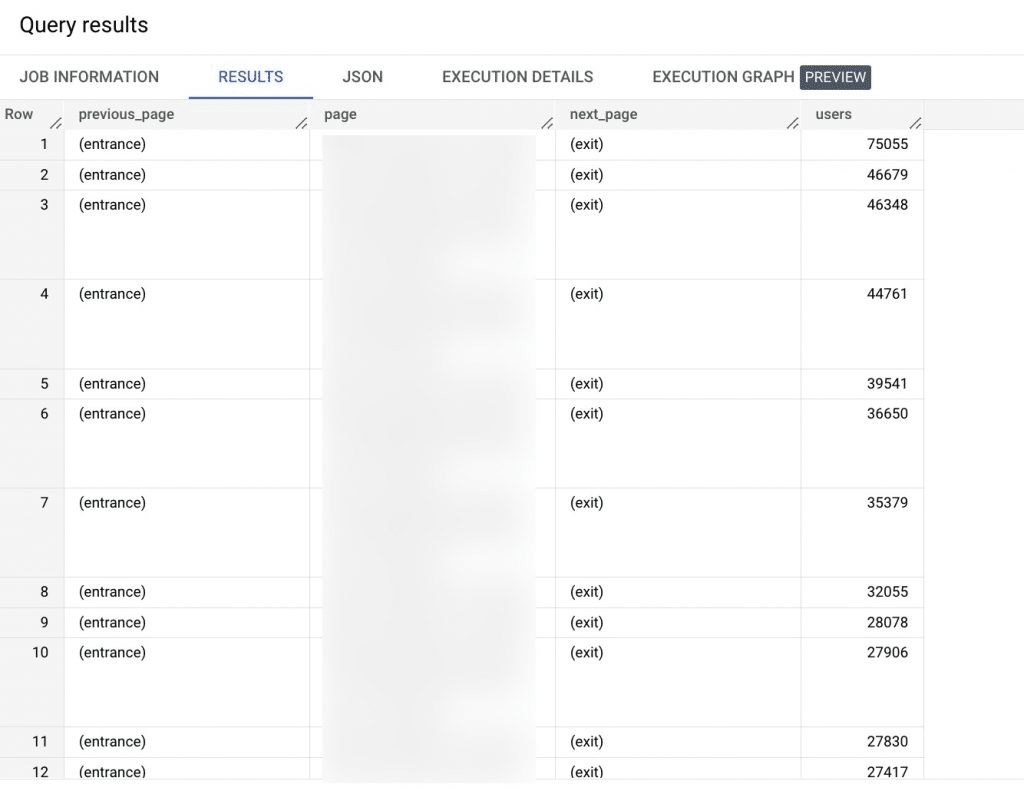
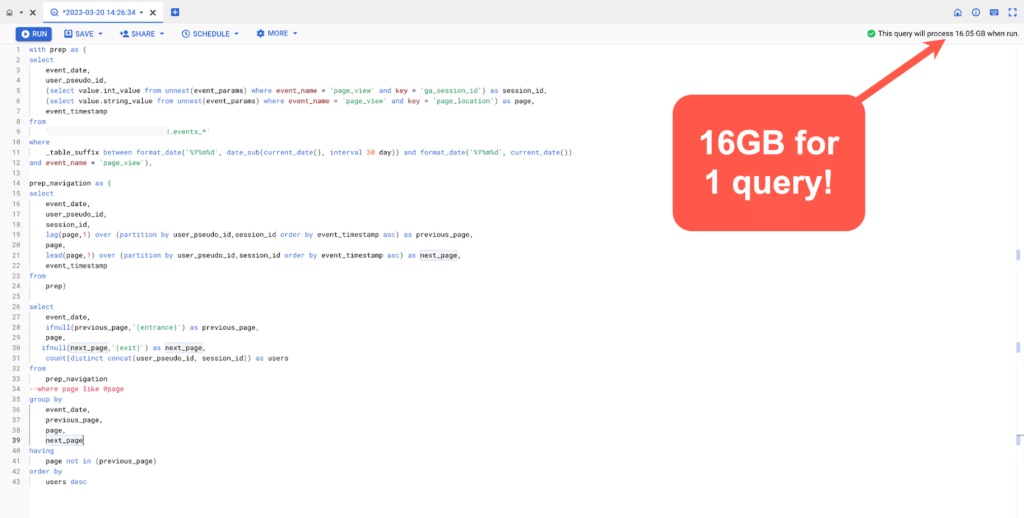
My goal was to use BigQuery to display the data, using a custom query:
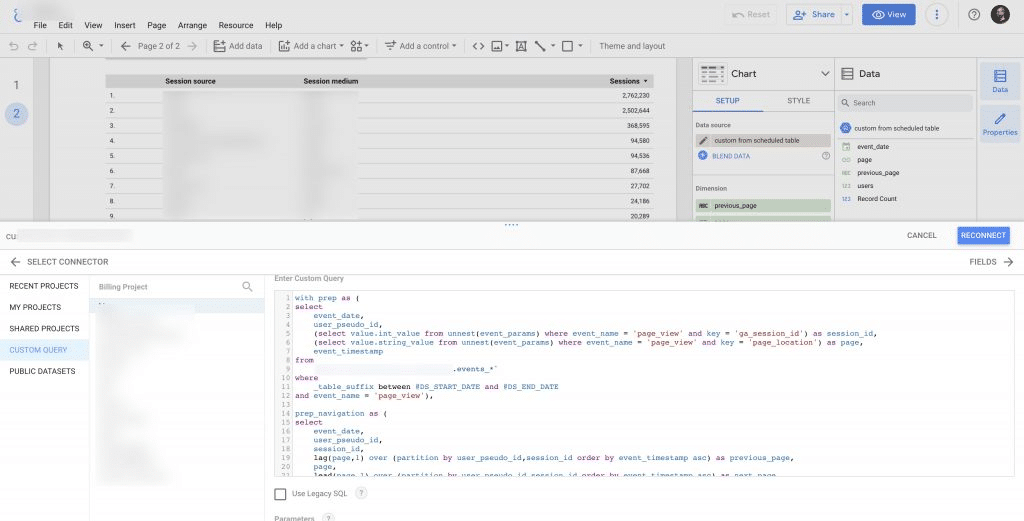
The problem was that this query, which I ran across only 30 days of data, cost 16GB!
What’s the problem with that?
The connection of Google Analytics to BigQuery is indeed free, but you only have 1TB of free credits each month for running queries. Any query beyond that will cost you money.
If you do a back-of-a-envelope calculation – it’s enough for my client to open the report once a day, and each time play a little with the date ranges (every such change running a new query in BigQuery) – and pretty quickly he’ll finish the quota of the free 1TB.
So although each terabyte only costs a few dollars, consider that you are creating an entire dashboard that is entirely composed of queries to BigQuery (to avoid Looker Studio’s new limitations), and each such report runs a query on a lot of data and for a rather short period of time. You will quickly find that these amount to many terabytes, which can bill for hundreds of dollars a month.
And besides, if it can be done in a more economical way then why not do it?
The solution – Scheduled Queries
When you use a custom query in Looker Studio, you query your raw data every time. In practice, this is a huge table that contains all the columns, for all your events (the rows in the table).
Given the fact that most of the time you don’t need at least 80% of the data – it’s completely redundant.
What you can do instead, is create a compact table that will contain only the relevant information, and make sure that it is updated daily. Then, every time you run your custom query – it will only query that table and not your entire dataset.
To do this, I simply click on schedule and then create a new scheduled query:
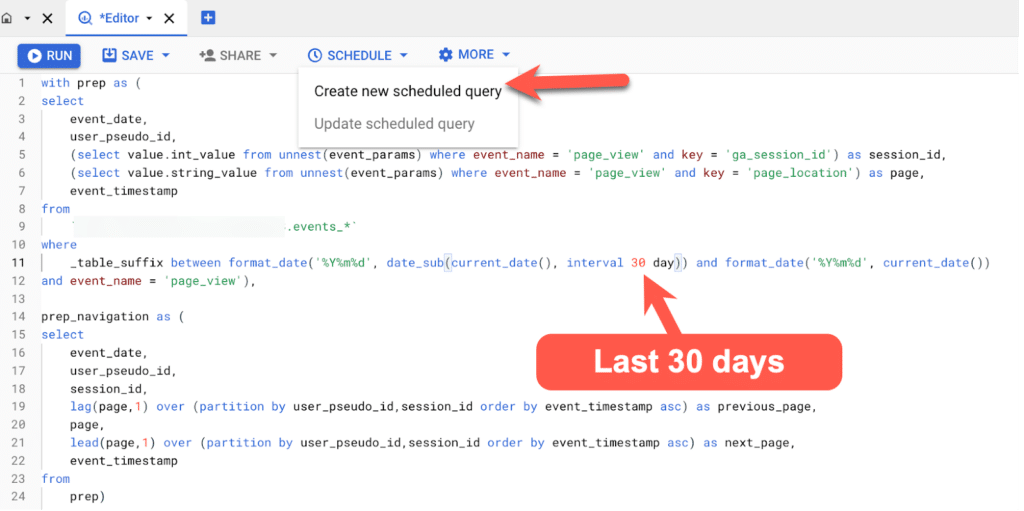
Note that I did not choose a specific date, but rather wrote it as:
events_*and then
where
     _table_suffix between format_date('%Y%m%d', date_sub(current_date(), interval 30 day)) and format_date('%Y%m%d', current_date())
That means the last 30 days.
A note for advanced users:
Today’s and yesterday’s table are in events_intraday until they are processed and only then are they transferred to events, so if you really want to be on the safe side it is better to use
where REGEXP_EXTRACT(_table_suffix, r'[0-9]+’) between format_date(‘%Y%m%d’, date_sub(current_date(), interval 30 day)) and format_date(‘%Y%m%d’, current_date())
Then it will query both events and events_intraday.
Now, this screen will open up on the side:
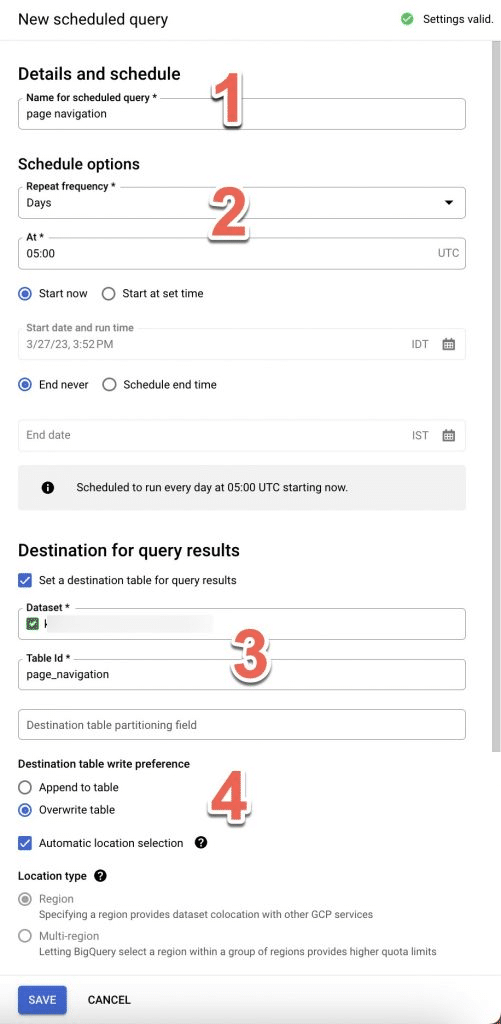
- Name your query
- Set a schedule of the query’s run: how often (I chose daily), at what time (pay attention to the time zone), and when the schedule will start and end.
- Set the location of the new table – Mark the checkbox Set a destination table, and then under Dataset start writing the name of your dataset, and under Table Id give your table a memorable name.
- Choose whether the new query will overwrite the existing table, or just add to it. I chose to overwrite so that if any new schema (i.e. columns) enters – it will be included in the table.
That’s it. Now click save and your query will appear here:

After your query runs, you can find the new table under your dataset, and you can see that the new table only contains the few fields we selected:
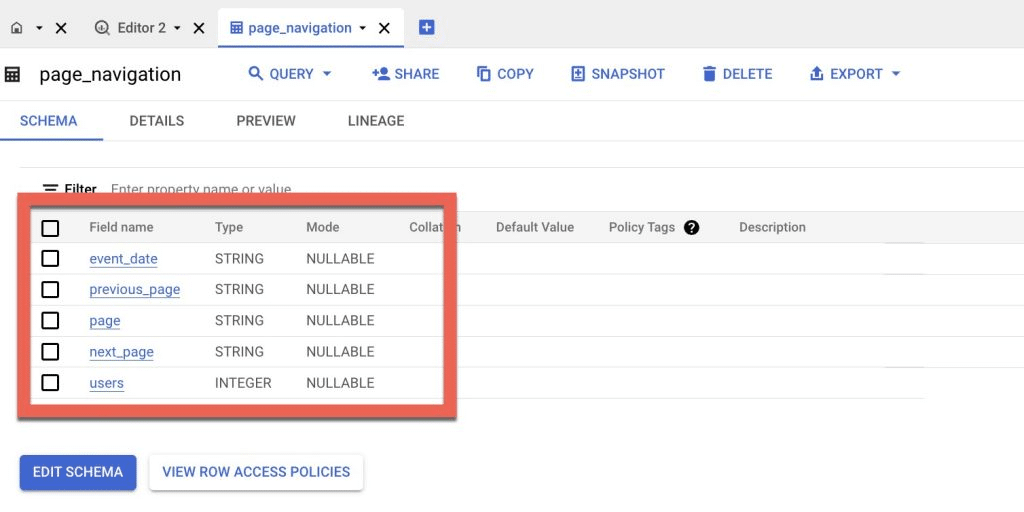
If you click on details you can see that the table is significantly smaller, in this case, it’s only 463MB:
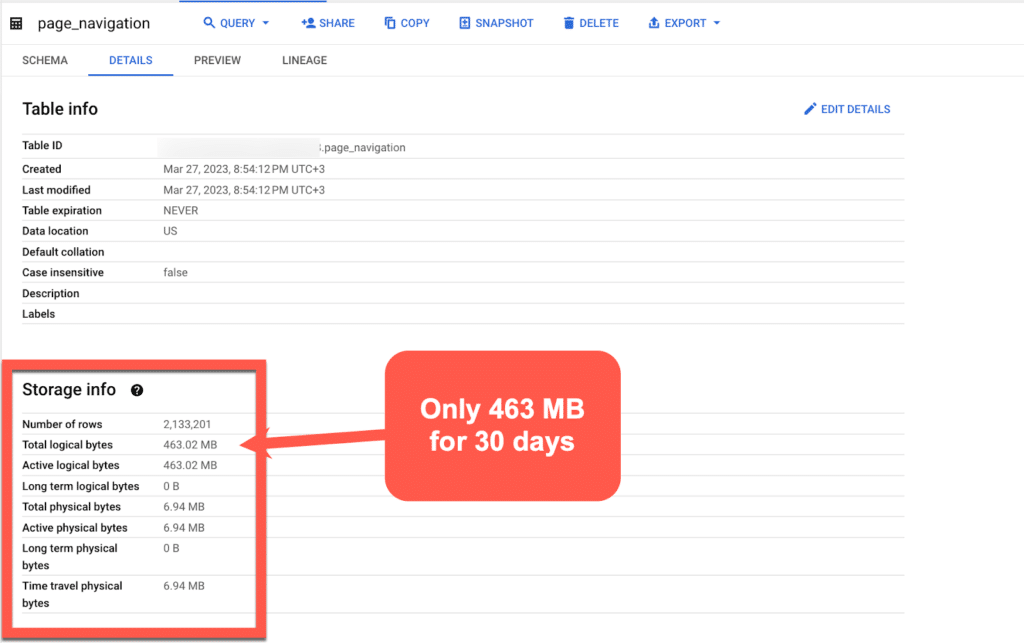
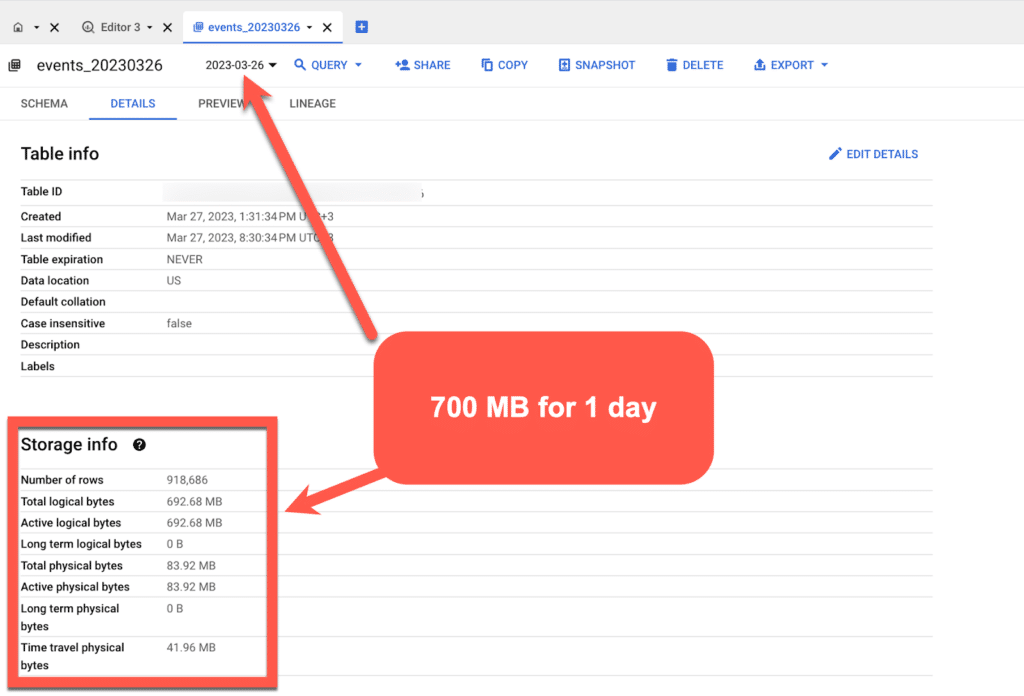
And this compared to the original table, which is 700MB for one day of data:
And back to Looker Studio:
Now we have 2 options to bring the data to Looker Studio.
Option 1 – Select the new table we created
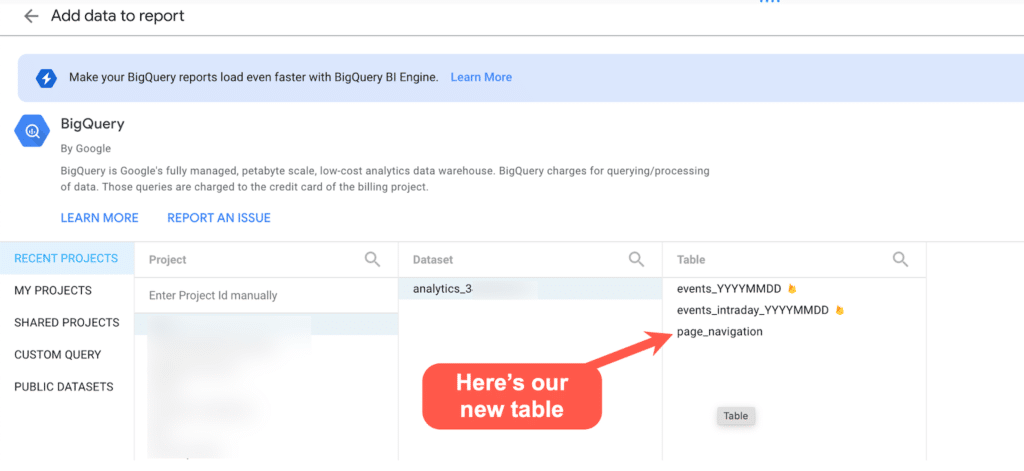
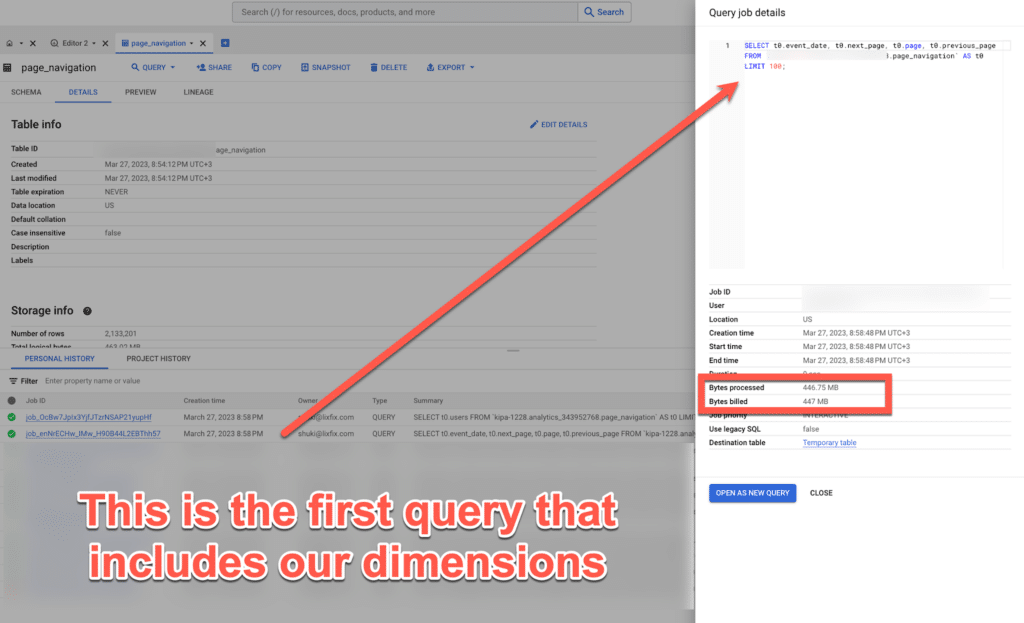
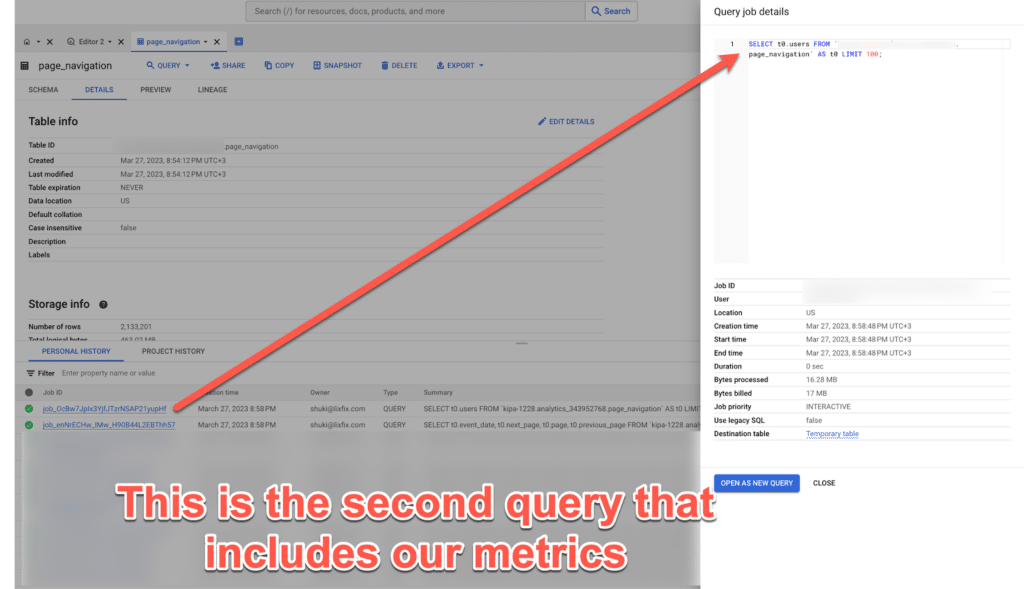
After selecting the new table, I went to Personal History to see how much the query “cost us”, and I can see this:
And this is what it looks like in Looker Studio:
Of course, I added an option to select dates, and every time I change a date – it uses the existing data that was downloaded when I connected the table and does not run a new query to BigQuery:
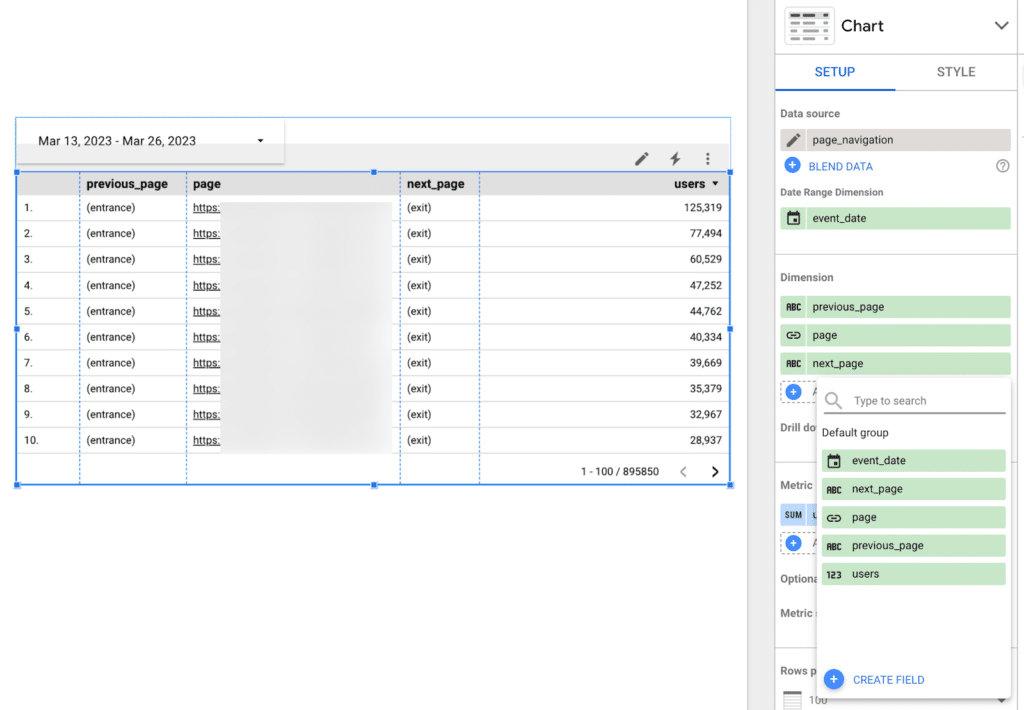
Of course, you have to remember that if I select dates from before the last 30 days – the report will not show anything, because our BigQuery table only contains the last 30 days each time.
You can change this of course, but it means your basic query will consume more data.
Option 2 – run a custom SQL query on the new table
We’ll just do a SELECT * from the new table, only this time we’ll have to insert the parameters @DS_START_DATE and @DS_END_DATE for our date to work, otherwise, it’s just
will take the table as it is and will not change anything even if we change dates:
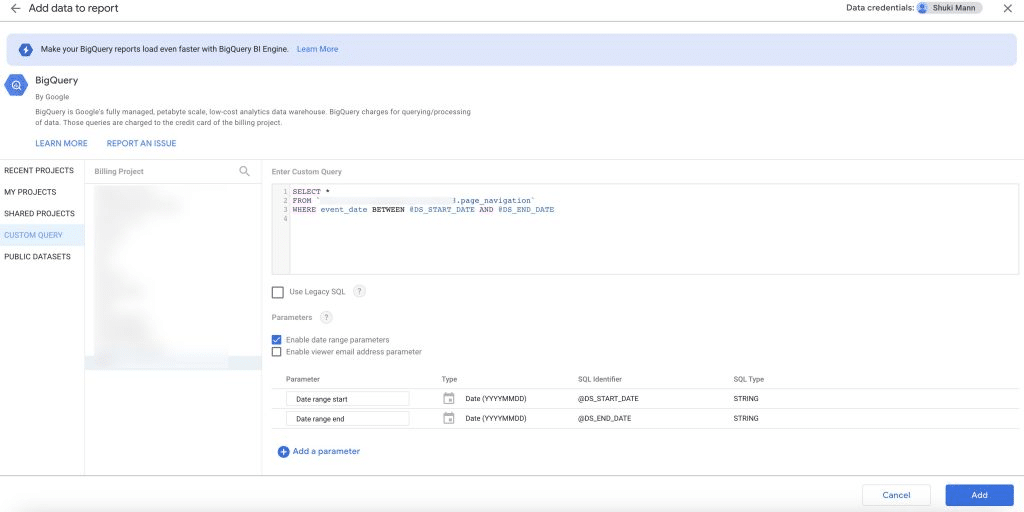
An important final note
In the examples listed here, I only referred to a single report.
Although it was heavy, my table contained only 4 columns except for the date, which is a very simple use case.
When creating an entire dashboard that is based on data from BigQuery, it is, of course, advisable to plan it differently, and perhaps create a query that builds all the columns, then in Looker Studio you simply select the columns you want.
This will of course affect the way you want to bring the data to Looker Studio – whether to bring the entire table or use a custom SQL query.
Another important thing to note is that your scheduled query will run at the frequency you set and consume gigabytes, even if no one actually enters the reports.
That’s why you should optimize it from time to time and remove any redundancies.
In my case, it consumes about 15GB per day. It’s not much – but it’s a shame that it will just run if no one uses it.